This entry is a collection of experiences that I acquired during many years of work on IT projects. One thing is certain, no matter how well you design the system architecture, how good tests you will write and how to buy the efficient machine - failures will happen. The most important thing is to prepare for such situations, have a plan of action and be able to detect and react to them as soon as possible.
When thinking about monitoring the application, it should be divided into three main areas:
- 1. Infrastructure
- 2. Application status
- 3. Business metrics
Infrastructure
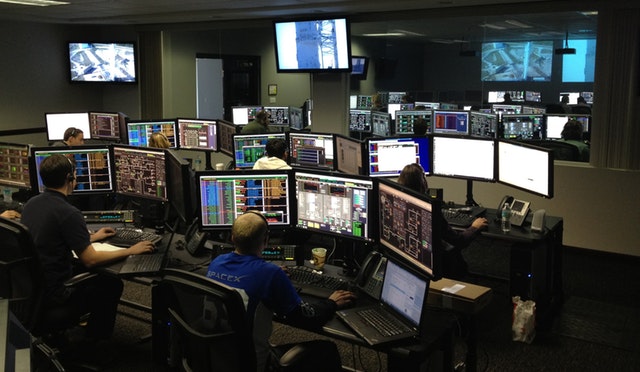
IT has it to yourself that the projects that we create are always based on the use of the same resources, they are: processor (CPU), memory (RAM), input / output devices (I / O), e.g. HDD, Internet network. Therefore, the first point that should always be monitored regardless of the theme of the project are resources. In distributed systems, such as those that operate on many physical or virtual machines, this is even more important because an early detected failure of a small part of the infrastructure can prevent a larger failure of the entire system, which in the case of a properly developed maintenance strategy is perfectly ok. As long as other metrics do not fall below the assumed level of availability, failures may occur in a controlled manner.
What is worth monitoring in the case of infrastructure:
- - CPU usage
- - RAM usage, both occupancy and% saturation of the transfer capacity
- - the amount of free HDD space, please also remember about IOPS
- - bandwidth of network cards
- - number of running processes fighting for access to the CPU
Application status
Each built application meets other functionalities and contains a different business logic. However, what they have in common are mechanisms and libraries. For example, a simple CRM will consist of an HTTP server, a database, a quick cache storage, integration with several external APIs. These are virtually constant elements, and it is up to the development team to program these elements together to form the whole of the customer's requirements. The basic question is "is our backend service available?". Observing the number of requests to the HTTP server, the ratio of correct / wrong answers, response codes, all this should be monitored in our application, of course, the metrics should be collected per endpoint. Monitoring this information can say a lot about the state of the system to the operator who does not know the details of the system, he can learn from them the basic conclusions about the state of the application.
Latency monitoring deserves a separate paragraph. For production systems, the goal is to maintain latency at an appropriate level, so that the end users of the system do not feel discomfort caused by waiting too long for events in the application. Measuring the same means is not a good idea, the measure of the average can hide many important details and I personally think that it should never be used. A good solution is to monitor the percentile, eg p95, p98, p99, p999 - that is, the level of latency experienced by successively 95%, 98%, 99% and 99.9% of users. For example, the measure of p95 latency at 100ms (0.1 seconds) and p99 at 900ms says that 95% of users expect only 100 ms for application response, while 99% expect 900ms. This means that at least 4% of users experience a significant increase in latency and this may indicate bottlenecks in the application that should be examined and possibly optimized (eg database query). Monitoring delays deserves a separate article, interesting ones I refer to a reliable article: https://igor.io/latency/ .
Business metrics
The last aspect of the system that should be monitored is a specific topographical projection of the application. Business metrics should answer business questions and their collection should be individually implemented in the code each time. These measures should record standard system events that take place within the so-called "business as usual" - means the daily work of the system. The need to monitor such system features came from our experience, we repeatedly collided with the situation when measures of infrastructure and applications showed normal values, which could not in any way infer a failure, and after a few hours it turned out that there is a problem somewhere. For example, in the operation of an online store accepting online payments, you should register events related to the execution of payments by users. Such measures include the number of successful payment attempts, the number of unsuccessful payment attempts, the sum of payments, the status of the payment provider. Monitoring such events will allow you to quickly detect possible problems with the payment partner or ongoing trials of the so-called frauds (or frauds). Always in the search for new solutions, we model ourselves on large companies that are willing to share their knowledge, I recommend a great article (and the entire blog) Ubera about the "observability" of business .
Notifications
Once we are monitoring our application, we should consider introducing notification protocols for events and failures. It makes no sense (if we do not support hundreds of users per second) to create your own monitoring center, where 24/7 operators are staring at the monitors. At the beginning, it is enough for us to set thresholds of normal values for the metrics we collect and automatic alerting (email, sms) if these values are exceeded by automated systems, so-called detector. Setting limits should be balanced, we do not want to receive notifications too late, we do not want to receive notifications too often or often (false positive). In my opinion it is a constant process (setting alert thresholds) in which we calibrate and react. For example, setting the threshold for CPU, memory, and disk space to 80% will only give us alarming in really serious situations, but soon enough that we still have a lot of time to react.
What to use for monitoring?
Monitoring is a vast subject and many engineers have hit it in the past so far, the wheel has been invented a long time ago and the only issue is the decision to choose the right tools. Our stack, tested for several years of use, includes:
- 1. Telegraph - a program written in Golangu that runs as a background process on the machine. It has dozens of entry and exit plugins. Its task is to collect metrics, aggregate and interval sending to an external database. Telegraph is able to collect data from the operating system, resources, databases and http servers. It also has a plugin that accepts data in the StatsD format. Thanks to Golang, the application is compiled into a single binaries and can be installed on the server using SystemD.
- 2. InfluxDB - time series database - allows you to store millions of metrics, a scalable database, well suited to the above-mentioned. applications. The project is also written in our favorite language - Golang.
- 3. Kapacitor (from the InfluxData stall) - a framework with its own language (DSL) for programming notifications and detection of anomalies in birth certificates. Kapacitor constantly monitors the records, if one enters the alarm state, sends pre-programmed notifications. He can also detect anomalies thanks to the implemented machine learning solutions.
- 4. Grafana - a tool that can connect to InfluxDB and download all the metrics we are interested in, displaying data on legible and modern dashboards.
The combination of these elements will provide us with constant access to information about birth certificates and allow us to set notifications. The flexible architecture allows you to add new resources for monitoring in a few commands, and the performative database will allow scaling when you start collecting large quantities of metrics.
To sum up, the above text is only a cursory outline of the topic, monitoring the application of IT systems is a very broad concept and requires a lot of knowledge and experience. If you have any questions, please write to us .