Open-source toolkit for monitoring infrastructure status
Grafana + InfluxDb
Monitoring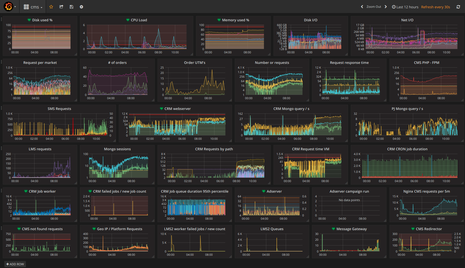
In the course of years of experience in maintaining applications, we have chosen the perfect technological stack that provides us with the ability to monitor every aspect of the application and react through set up alerts and notifications.
- Telegraf + StatsD - collecting machine and application records
- InfluxDB + Kapacitor - aggregation of metrics and detection of anomalies
- Grafana - dashboards with metrics and sending alarms in the event of exceeding the set thresholds